



Launching a modernized digital experience is a significant milestone, but it is not the same as achieving business success. Organizations invest in redesigned customer portals, enterprise applications, and digital platforms with expectations of improved efficiency, stronger adoption, reduced operating costs, and better customer experiences. Yet once these initiatives go live, many organizations struggle to demonstrate whether those expectations have been met.
The problem is rarely a lack of data. Most organizations have access to analytics platforms, operational reports, customer feedback, and performance metrics. The challenge is connecting those sources into a coherent picture of business performance.
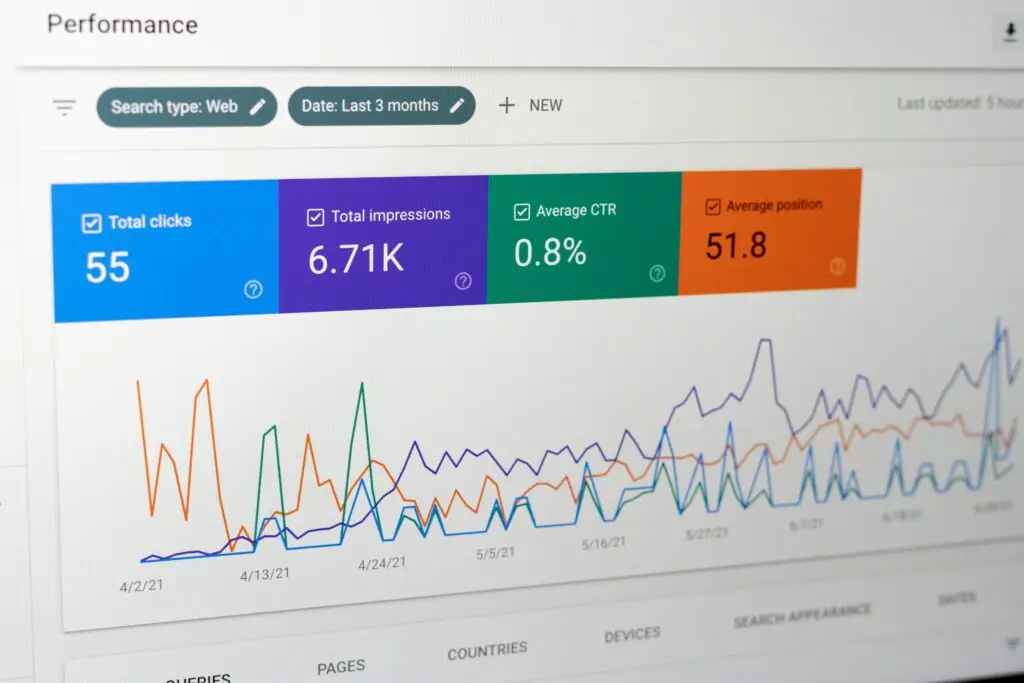
An executive dashboard can bridge that gap, provided it measures more than traffic, engagement, and technical performance. The objective is to establish whether modernization is producing the business outcomes that justified the investment.
Why Launch Success and Business Success Are Different
Digital modernization projects are often evaluated against delivery milestones. Was the platform launched on schedule? Did the team stay within budget? Were the planned features delivered? Did the application pass quality assurance testing?
These are important measures of project execution, but they reveal little about whether the investment created meaningful business value.
Consider an organization that modernizes a customer self-service portal. The project launches successfully, page performance improves, and customer satisfaction scores increase. However, customers continue calling support representatives to complete routine transactions. The organization has delivered a better digital experience without achieving its primary operational objective.
This distinction is especially important for technology-enabled services organizations and mid-market enterprises, where digital investments are frequently intended to improve scalability. A successful launch should ultimately change how customers or employees accomplish important tasks, not simply provide a more modern interface.
Launch ROI is the measurable business value realized after a digital product or experience goes live, evaluated against the investment required to deliver and sustain it. An executive dashboard should make that relationship visible while distinguishing early indicators of progress from demonstrated financial results.
Start with the Outcomes That Justified the Investment
An effective executive dashboard begins with a simple question: What business problem was this modernization initiative supposed to solve?
That question should have been answered during the planning process, but it becomes especially important after launch. Without clearly defined objectives, organizations tend to report whichever metrics are readily available rather than those that demonstrate meaningful progress.
For example, a customer portal modernization initiative might have three primary objectives: increase self-service adoption, reduce assisted-service costs, and improve customer retention. Each objective requires different measurements.
Self-service adoption can be evaluated through the percentage of eligible transactions completed digitally. Assisted-service costs can be assessed through support volume, handling time, and cost per transaction. Retention requires examining whether customers continue using the service over time.
The dashboard should establish a clear relationship between the investment, the expected behavioral change, and the resulting business outcome.
This approach also prevents a common reporting problem: presenting positive metrics that have little connection to the original business case. Increased page views may indicate greater activity, but they do not necessarily demonstrate that customers are completing tasks more efficiently or that the organization is operating more effectively.
The Four Dimensions of an Executive Launch Dashboard
While every organization has different objectives, most modernization initiatives can be evaluated across four interconnected dimensions.
1. Adoption: Are People Using the Modernized Experience?
Adoption is often the first indication that a modernization initiative is gaining traction. However, measuring adoption requires more than counting logins, sessions, or registered users.
Executives need to understand whether the intended audience is using the experience to accomplish the activities it was designed to support.
For a customer portal, that might mean measuring the percentage of customers completing key transactions independently. For an internal enterprise application, it could involve tracking whether employees have transitioned away from legacy tools and manual workarounds.
Adoption should also be evaluated over time. Initial usage may be influenced by launch communications, training, or organizational mandates. Sustained adoption provides stronger evidence that the experience is meeting user needs.
2. Efficiency: Are Important Tasks Becoming Easier?
Modernization frequently promises greater efficiency, particularly when replacing fragmented workflows or legacy applications.
Useful measures include task completion time, error rates, repeated data entry, workflow abandonment, and the number of interactions required to complete a process.
For example, reducing an employee workflow from twelve steps to six may improve usability, but the business impact depends on how frequently the task occurs and how much productive time is recovered.
An executive dashboard should therefore connect experience efficiency to operational performance rather than reporting usability improvements in isolation.
3. Business Performance: Are We Realizing Economic Value?
This dimension connects adoption and efficiency improvements to measurable business outcomes.
Depending on the initiative, relevant metrics might include cost per transaction, support costs, revenue conversion, customer retention, employee productivity, or the volume of work completed without additional staffing.
Suppose a modernized service portal increases digital transaction completion from 60% to 75%. That improvement becomes financially meaningful when the organization can demonstrate how many assisted transactions were avoided and the associated reduction in service costs.
Executives should also distinguish between projected benefits and realized savings. Recovered employee hours, for example, represent additional capacity, but they do not automatically translate into reduced expenses unless the organization changes staffing requirements, avoids additional hiring, or redirects capacity toward productive work.
4. Experience Quality: Is Performance Sustainable?
Business improvements are unlikely to persist if the underlying experience remains frustrating or unreliable.
Experience quality metrics help organizations identify problems that may undermine adoption or operational performance over time. These include task success rates, accessibility, application reliability, customer feedback, and recurring usability issues.
User research plays an important role here. Analytics may show declining adoption, but research can reveal whether users are encountering confusing workflows, missing capabilities, or technical limitations.
Experience quality should not be treated as a separate design concern. It is an important indicator of whether the business benefits of modernization can be sustained.
Build a Dashboard That Explains Performance, Not Just Reports It
An executive dashboard should provide a concise view of performance while allowing decision-makers to investigate meaningful changes.
Rather than displaying dozens of unrelated metrics, each business objective should be associated with a small number of indicators that explain whether the organization is moving toward its intended outcome.
A practical dashboard might include:
| Business Objective | Executive KPI | Supporting UX Metric |
|---|---|---|
| Increase digital adoption | Percentage of eligible transactions completed digitally | Task completion rate |
| Reduce service costs | Cost per completed transaction | Assisted-service requests |
| Improve employee productivity | Transactions completed per employee hour | Average task completion time |
| Increase customer conversion | Completed applications or purchases | Journey abandonment rate |
| Improve customer retention | Customer renewal or retention rate | Recurring usability issues |
Each metric should include a baseline, target, current performance, and reporting period. Where possible, dashboards should also show trends and meaningful differences across customer segments, business units, or user groups.
This context matters because an isolated number rarely tells executives what action to take.
A 15% improvement in task completion may be encouraging, but its significance depends on whether the improvement occurred in a critical workflow, how many users were affected, and whether it contributed to the intended business outcome.
Measure Progress at 30, 60, and 90 Days
Organizations should establish a post-launch measurement plan before implementation is complete. Waiting until several months after launch often means discovering that important baseline data was never captured or that analytics cannot measure critical user actions.
A phased evaluation provides a more useful picture of how value develops.
During the first 30 days, the emphasis should be on technical stability, initial adoption, task completion, and identifying unexpected friction. Early behavioral data can reveal problems that were not apparent during testing.
By 60 days, organizations can begin evaluating sustained usage, workflow efficiency, support trends, and differences between expected and actual user behavior. Research can help explain why certain groups are adopting the experience while others are not.
At 90 days, executives should have a clearer picture of whether the initiative is progressing toward its business objectives. Some financial outcomes may already be measurable, while others, particularly retention and long-term operating efficiencies, will require additional observation.
These checkpoints are not universal deadlines for proving ROI. They create a structured process for evaluating progress and identifying where further improvements are needed.

Use Dashboard Insights to Guide the Next Investment
The greatest value of an executive dashboard is not its ability to demonstrate that a project succeeded. It is its ability to inform what happens next.
Suppose a modernized portal achieves strong adoption but shows persistent abandonment during a particular transaction. That finding may justify targeted user research and workflow improvements rather than another broad redesign.
Alternatively, a new internal application may demonstrate substantial efficiency gains among experienced employees but poor adoption among occasional users. The appropriate response might involve simplifying infrequent workflows, improving contextual guidance, or addressing gaps in training.
These decisions require collaboration across business leadership, product management, UX, and technology teams.
Analytics identifies performance patterns. User research explains the behaviors behind them. UX strategy establishes priorities. Experience design and development translate those priorities into improvements that can be measured in subsequent reporting periods.
This creates a continuous connection between business objectives and digital investment decisions.
From Launch Milestone to Measurable Business Performance
Modernizing a digital experience should not end when the new platform goes live. The launch marks the beginning of a new phase in which organizations can evaluate whether the experience is delivering the improvements it was designed to achieve.
At UpTop, we approach UX modernization as an integrated discipline combining UX strategy, user research, experience design, and modern digital development. That approach helps organizations address the underlying causes of digital friction while establishing a clearer connection between experience improvements and business performance.
An executive dashboard supports that philosophy by making modernization outcomes visible, measurable, and actionable. It gives leaders a consistent way to evaluate adoption, operational efficiency, experience quality, and realized business value.
Ultimately, the most useful measure of launch success is not what the organization delivered, but what the organization can now accomplish more effectively because of it. Let’s talk.